

40 years of ECMWF forecasts
On 1 August 1979, the European Centre for Medium-Range Weather Forecasts (ECMWF) produced and disseminated its first operational global weather forecast for the following 10 days. The deterministic forecast was based on a numerical model with a horizontal grid spacing of about 210 km and 15 vertical levels up to 10 hPa. One year later the model went fully operational with daily forecasts. Since then, huge efforts were made regarding the performance of the model. The verification scores of the forecasts have steadily improved over the last 40 years at all lead-times, reflecting the achievements in data assimilation and model physics. Increasing computer performance was crucial for the successful evolution of numerical weather prediction during the last four decades. Thus, the horizontal grid length was continuously reduced, allowing, among other things, a more accurate representation of the world’s topography. The latest ECMWF model cycle has a horizontal grid spacing of 9 km and 137 vertical levels up to 0.01 hPa, such that nearly 40 grid points cover Luxembourg, in contrast to only one grid point back in 1979. The first 90 forecast hours of the model output have a temporal resolution of one hour, then up to day 6 the forecast step frequency is reduced to three hours and up to day 10 it is cut down to six hours.
Luxembourg is a Member State of ECMWF and is represented by MeteoLux at the ECMWF Council. MeteoLux uses the operational products and forecasts disseminated by ECMWF on a daily basis.
The figure below shows a comparison of ECMWF’s first 7-day forecast issued on 1 August 1979 (black and white image on the left) and ECMWF’s latest reanalysis for the same forecast day (coloured image on the right).
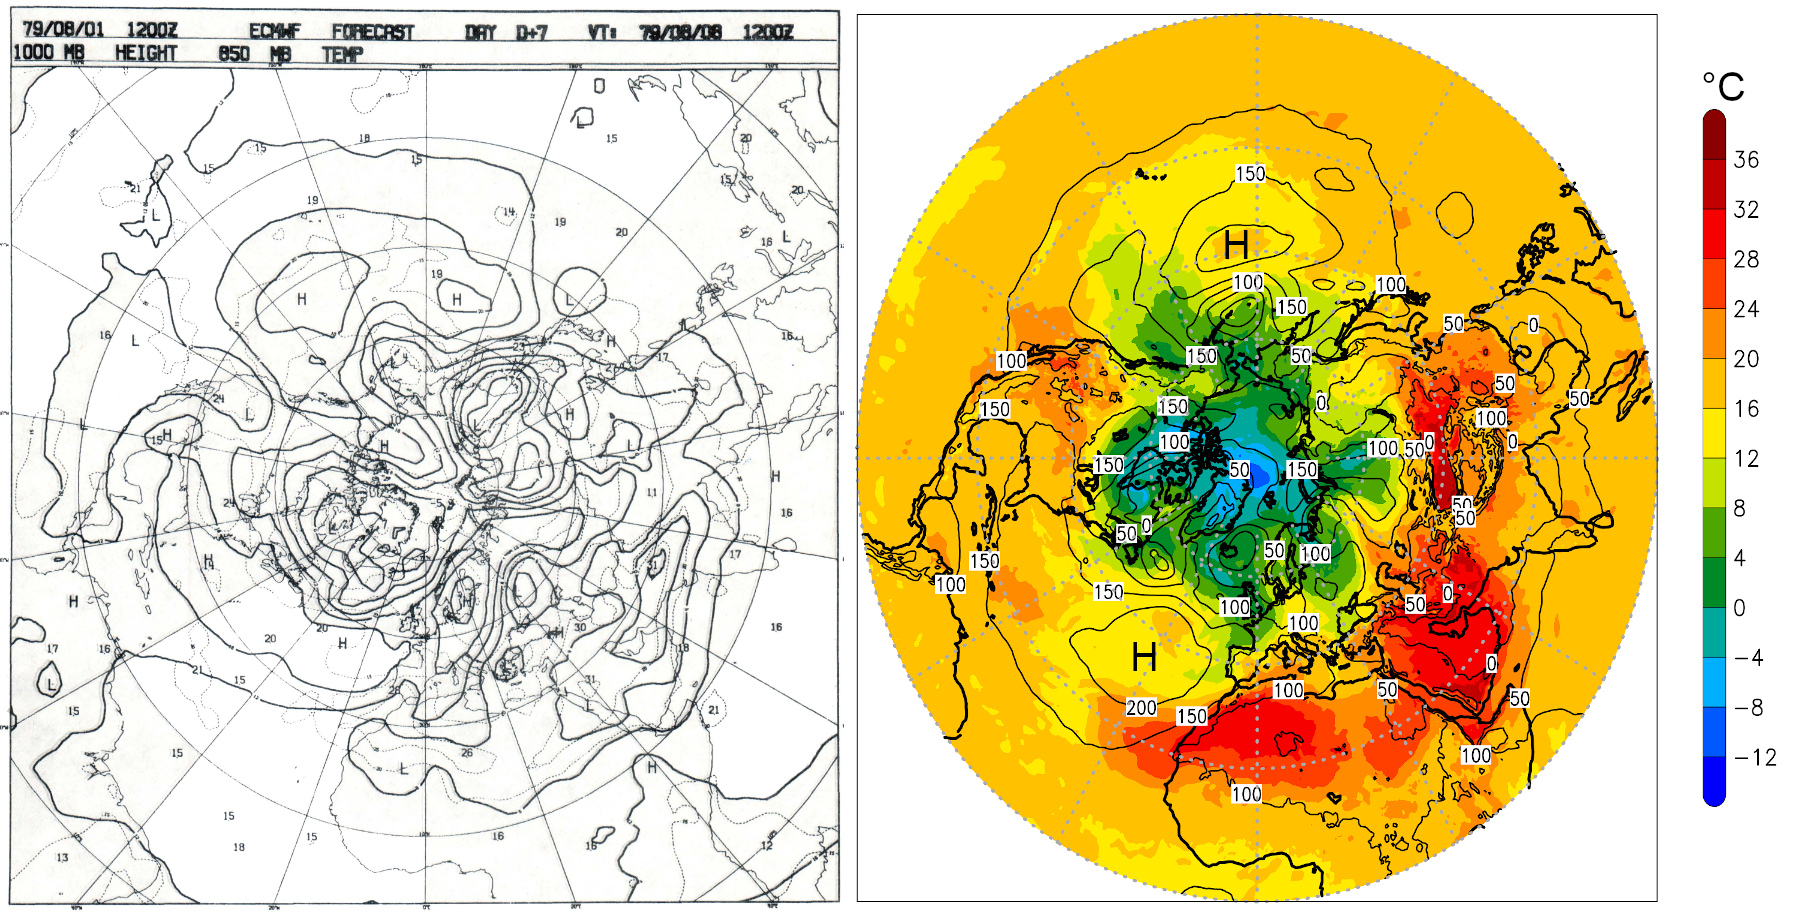
(Left) 7-day forecast of 1000 hPa geopotential height (gpdm; black lines) and 850 hPa temperature (°C; dotted black lines) issued by ECMWF’s first operational model forecast on 1 August 1979 (source: https://www.ecmwf.int/en/elibrary/19024-technical-newsletter-no-5-october-1979).
(Right) ECMWF’s ERA5 reanalysis of 1000 hPa geopotential height (gpm; black lines) and 850 hPa temperature (°C; shaded) at 12:00 UTC on 8 August 1979.
ECMWF celebrates 40 years of operational medium-range forecasting
